- Navigation
- Tools
- Legend
- Layers
Map Navigation
The web map opens by default to the full world view, unless it is entered into by a region-specific location on the Living Oceans Foundation website. At the global level, pins are placed for each ocean or sea that contains mapped data produced by the Foundation. You may always return to the Living Oceans Foundation's website by clicking on any of the menu items above the web map viewer. Note that the web map state is not saved if you click away to another location within the rest of website. Clicking the browser’s Refresh icon will reset the mapper to its default state at the full global view.
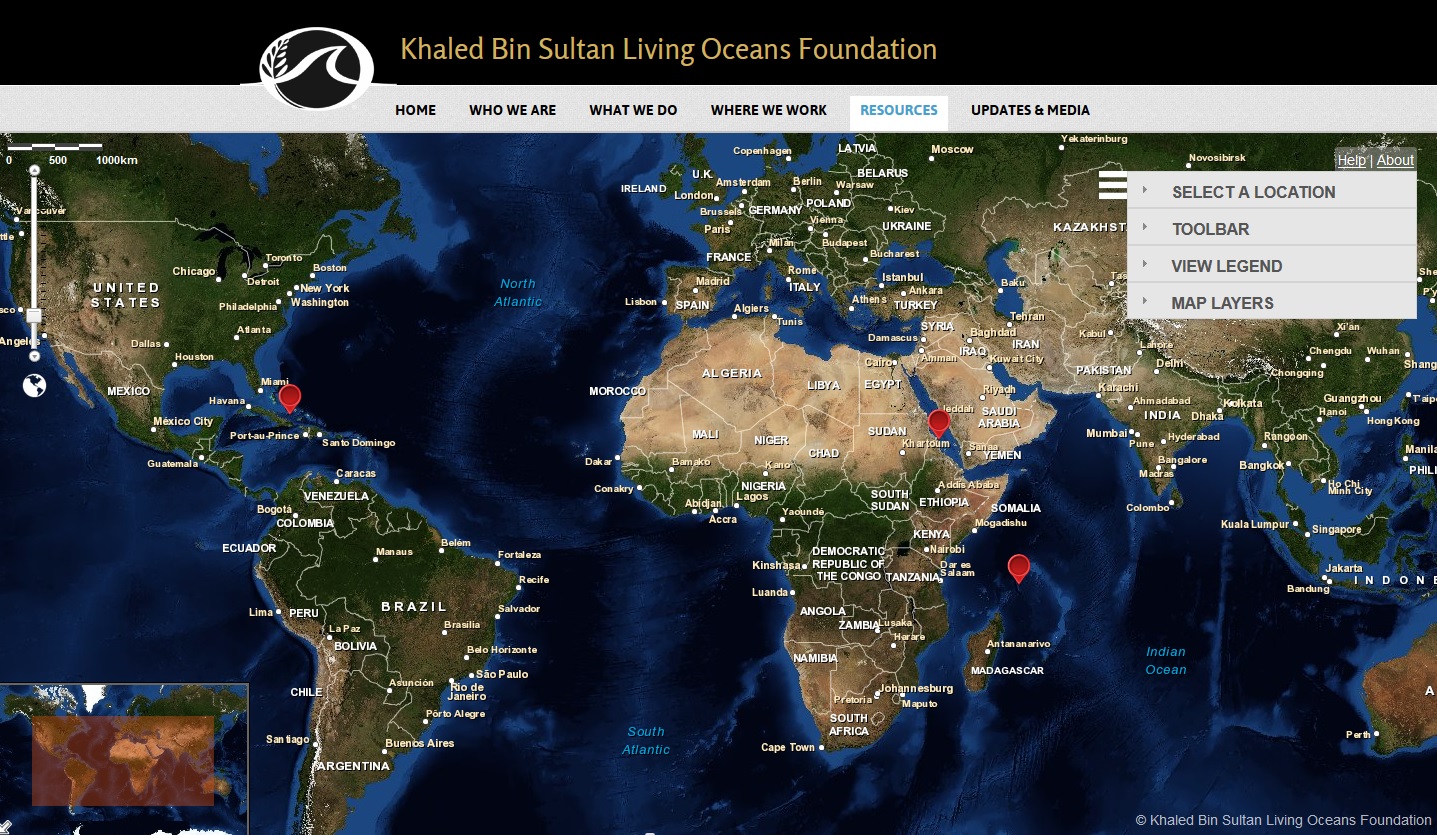
SELECT A LOCATION at the full extent with the ocean/sea level menu expanded
SELECT A LOCATION
Use the SELECT A LOCATION drop-down list to select an ocean/sea region and then a specific island area. You may also click a pin on the map to zoom to the ocean/sea where there is data. The map will automatically center based on each ocean/sea or island that is selected. Once zoomed to an ocean/sea region, red extent indicator boxes will appear that are clickable to zoom to mapped areas.
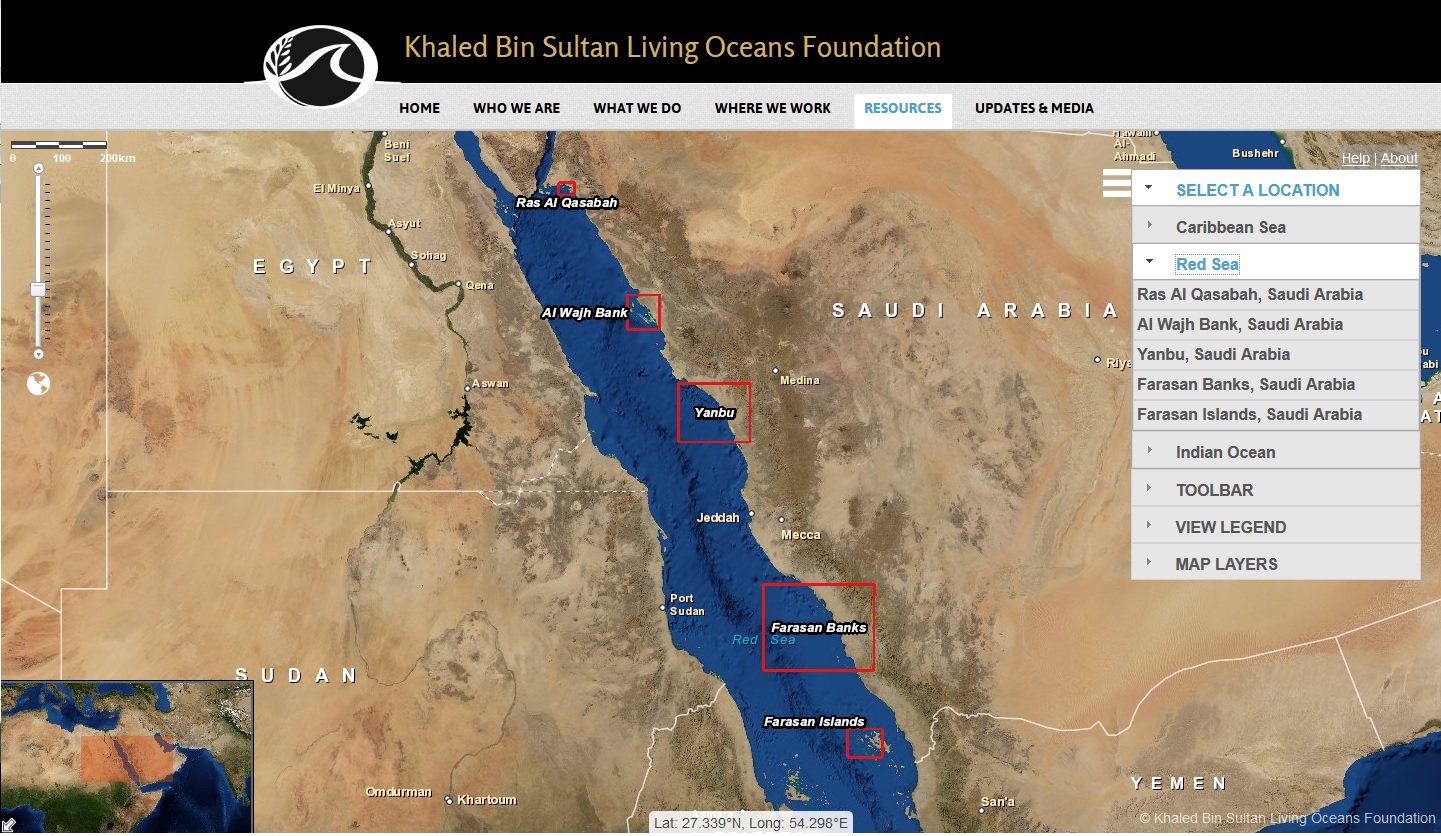
Select an island menu example
Using the Mouse
Drag to pan
Panning shifts the map in any direction to show a different area without changing the viewing scale. Left-click on the map, keeping your finger on the mouse. The cursor changes shape to a cross-arrow icon. Move or drag the map view until the map is positioned where you want it. When you release the mouse, the map automatically refreshes to the new view.
Mouse scroll forward to zoom in
Moving the mouse wheel, or scroll function, forward one click at a time allows you to zoom in the map in small increments.
Mouse scroll backward to zoom out
Moving the mouse wheel, or scroll function, backward one click at a time allows you to zoom the map out in small increments.
Double-click to center and zoom in
This function allows you to choose a point on the map and quickly zoom in. Left double-click on the point to be to zoomed in on. You can repeat this function several times to get the desired view.
Using Navigation Tools
Zoom slider
Zoom in incrementally by clicking the upward arrow at the top of the zoom slider bar. Zoom back out incrementally by clicking the down arrow at the bottom of the zoom slider. You may jump to a specific zoom level by clicking directly on the bar.
![]()
Overview/Inset Map
The Overview/Inset Map in the lower left side of the map shows the location of the displayed map in relation to the surrounding area. You may also use the Overview/Inset Map as a navigation tool by dragging the red box or by clicking on a point in the area surrounding the red box that will re-center the web map on that area. Click the arrow in the bottom left of the overview map to show or hide the Overview/Inset Map.
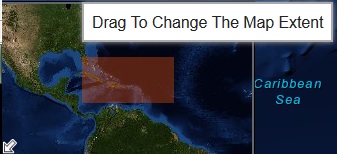
The Latitude/Longitude bar displays the location of the mouse cursor over the map and is visible at the bottom center of the map.
![]()
Toolbar
The TOOLBAR includes tools called Identify, Measure, Habitat Analysis, Data Download, and Print. Click TOOLBAR to display the tools and then click on a tool to activate it. Only one mapping tool can be active at a time. With the exception of the Identify tool, when the user clicks away from a tool or the entire TOOLBAR, the previous tool will be deactivated.
Identify
![]() The Identify Tool allows you to left-click a point on the map to display a pop-up box containing information about that point. Depending on what map layers are active, this information may include latitude and longtiude coordinates, the country and region, habitat name (if the Benthic Habitat Data layer is active), metric depth (if the Bathymetry or Depth Contour layers are active), or Habitat Video present at that location. If the Benthic Habitat Data layer is active, the Identify window may also contain a Habitat Description and Representative Photo, if available.
The Identify Tool allows you to left-click a point on the map to display a pop-up box containing information about that point. Depending on what map layers are active, this information may include latitude and longtiude coordinates, the country and region, habitat name (if the Benthic Habitat Data layer is active), metric depth (if the Bathymetry or Depth Contour layers are active), or Habitat Video present at that location. If the Benthic Habitat Data layer is active, the Identify window may also contain a Habitat Description and Representative Photo, if available.
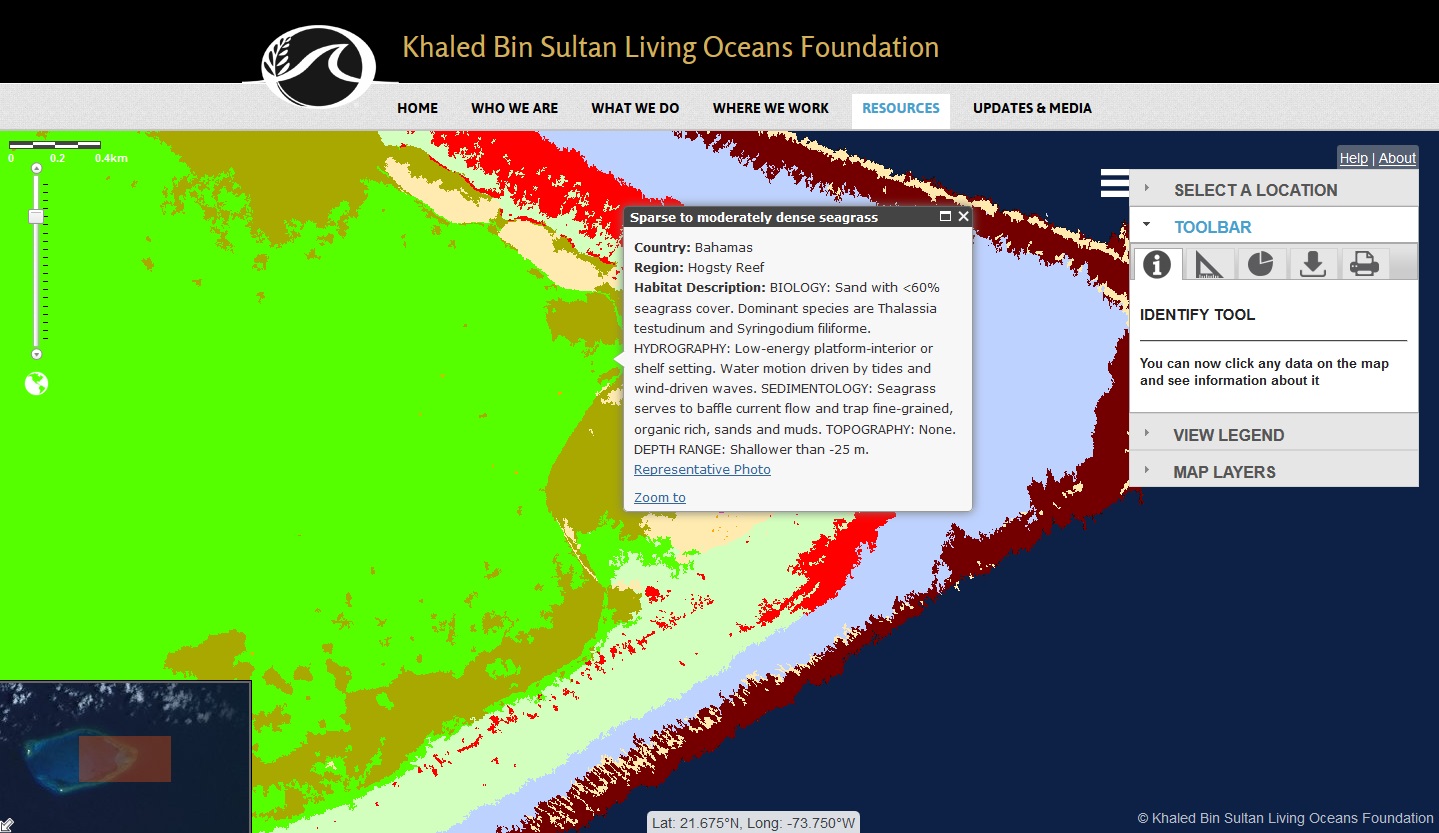
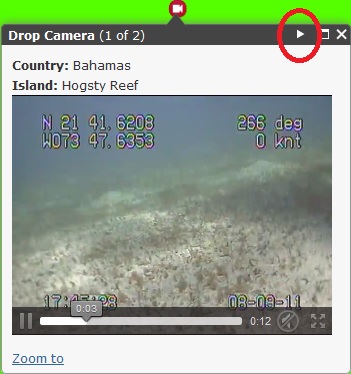
If the point clicked was where a Habitat Video is located, the video will appear first in the Identify window and any habitats or depth data present at that location will be viewable by clicking the right arrow at the top of the Identify window.
Click the X in the upper right corner of the results box to close it, or click in another location to return information about another point.
Measure
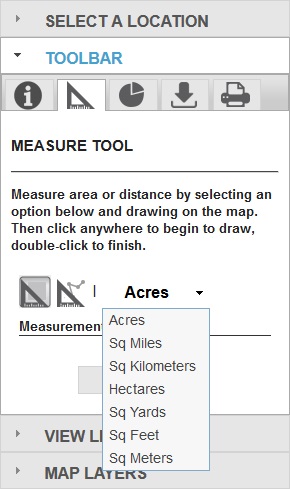
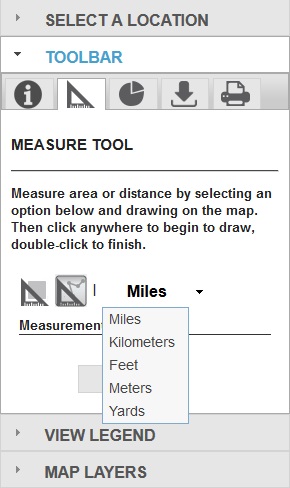
The Measure tool allows you to measure area and distance. To begin measuring, zoom in to the area you wish to measure then click the Measure tool. Click the area or distance button and choose a unit of measure from the drop down list by clicking on top of the units text or the black down arrow.
A dialog box drops down that contains buttons for measuring distance or area and a drop down that contains the units of measure. Area may be measured in acres, square miles, square kilometers, hectares, square yards, square feet, and square meters. Distance may be measured between two points or cumulatively between multiple points in miles, kilometers, feet, meters or yards.
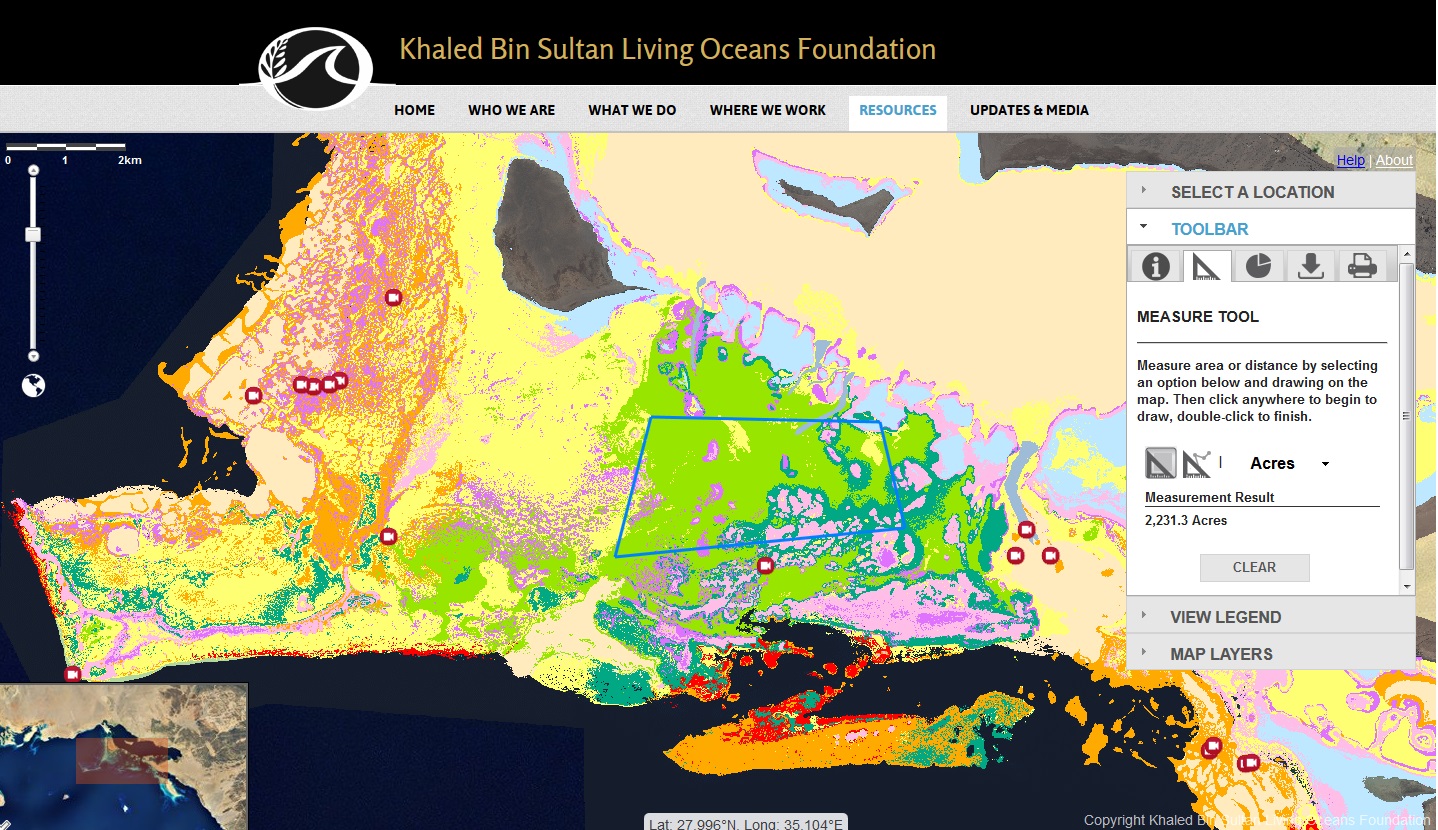
To measure area, click the Area button and select units of measure from the dropdown box to the right of the tool.
Click a point on the map where you wish to begin the measurement. Click the second point of the polygon. The first segment draws, and the polygon now stretches to the current position from the last point as well as to the initial point. As you move the mouse from this location, a blue line indicates the boundaries of the area you are clicking. Continue adding points (vertices) to the polygon. New vertices add segments connecting to the previously clicked location. When you want to complete the polygon, double-click when you reach the final point and the box will be enclosed. The area measurement will appear in the dialog box.
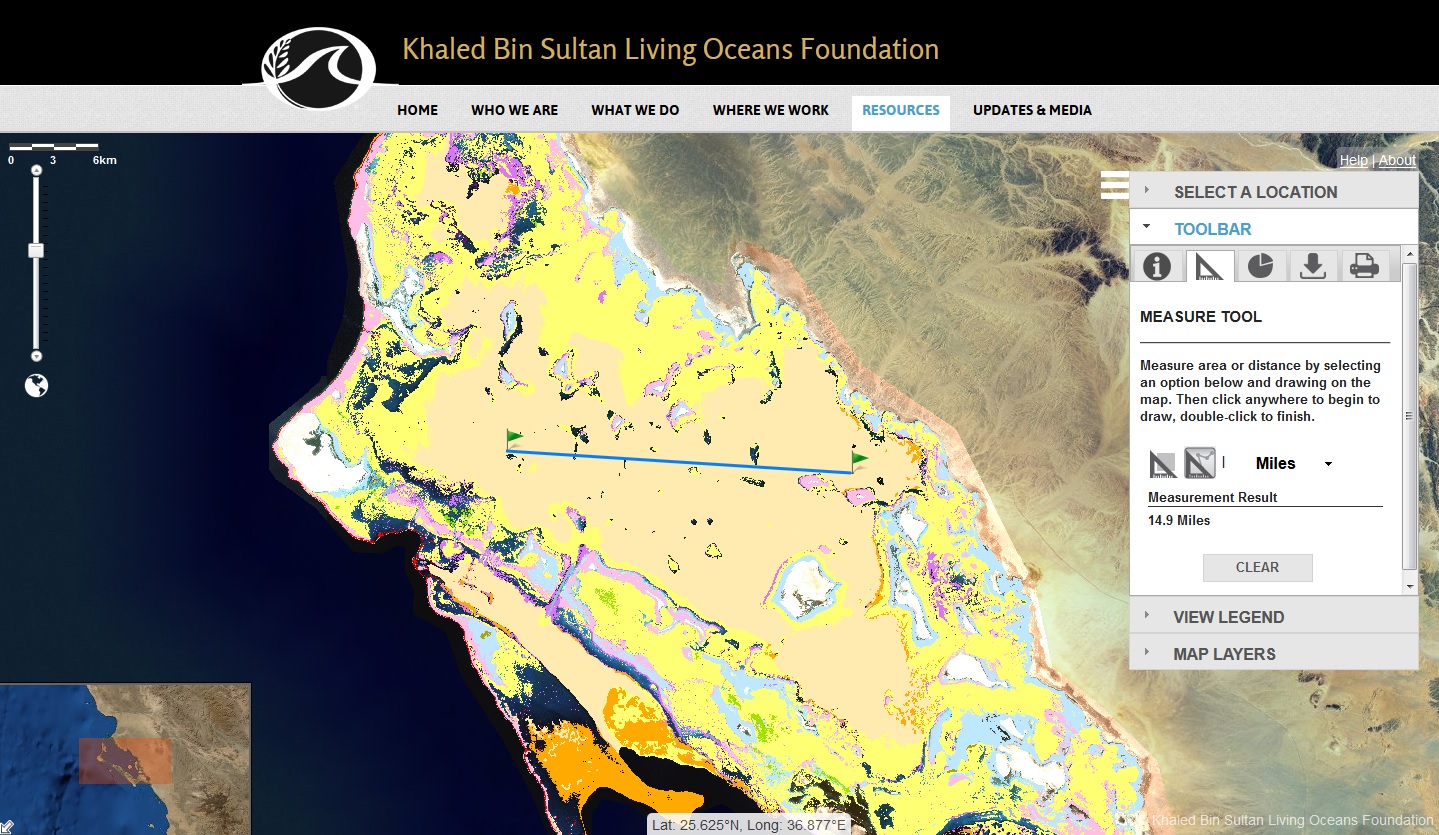
To measure distance, click the Distance button and select the desired unit of measurement.
Click the point on the map where you want to begin the measurement. Move the cursor to the second point of the line and click once. If measuring a line with multiple segments (polyline), continue clicking at each location you want to change direction to add segments. The line will appear blue and the distance along the line will accumulate in the dialog box.
Habitat Analysis
![]() Click the Habitat Analysis Tool button to generate a report of the composition of habitats for a specified area. A dialog box appears that allows you to select either a circle or draw a polygon.
Click the Habitat Analysis Tool button to generate a report of the composition of habitats for a specified area. A dialog box appears that allows you to select either a circle or draw a polygon.
![]() The Radius button allows you to set a buffer around a specific point to measure habitat types in a circular area. Click the Radius tool button, and then choose a unit of measurement for the results from the drop down.
The Radius button allows you to set a buffer around a specific point to measure habitat types in a circular area. Click the Radius tool button, and then choose a unit of measurement for the results from the drop down.
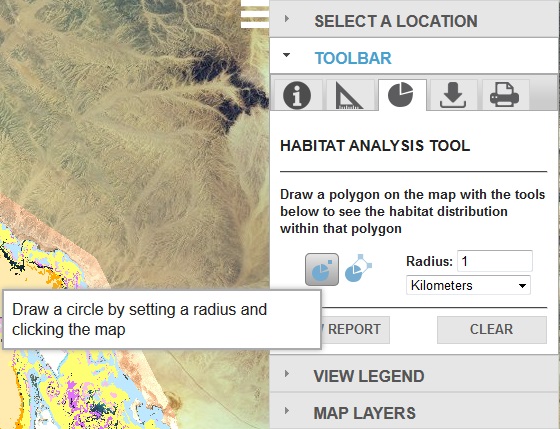
Click on the map to generate a report. After the map redraws, click View Report to see the results.
![]() The Polygon Tool lets you draw a polygon to define an area of interest. Click the polygon button, click on the map to begin placing points, then double-click to complete the polygon.
The Polygon Tool lets you draw a polygon to define an area of interest. Click the polygon button, click on the map to begin placing points, then double-click to complete the polygon.
Note that report generation can be time intensive and may take up to a minute, depending on the size of the area being analyzed and the number of habitat types present.
Click the Clear button to delete a previously defined area and draw a new area of interest or after the map redraws, click View Report to see the results.
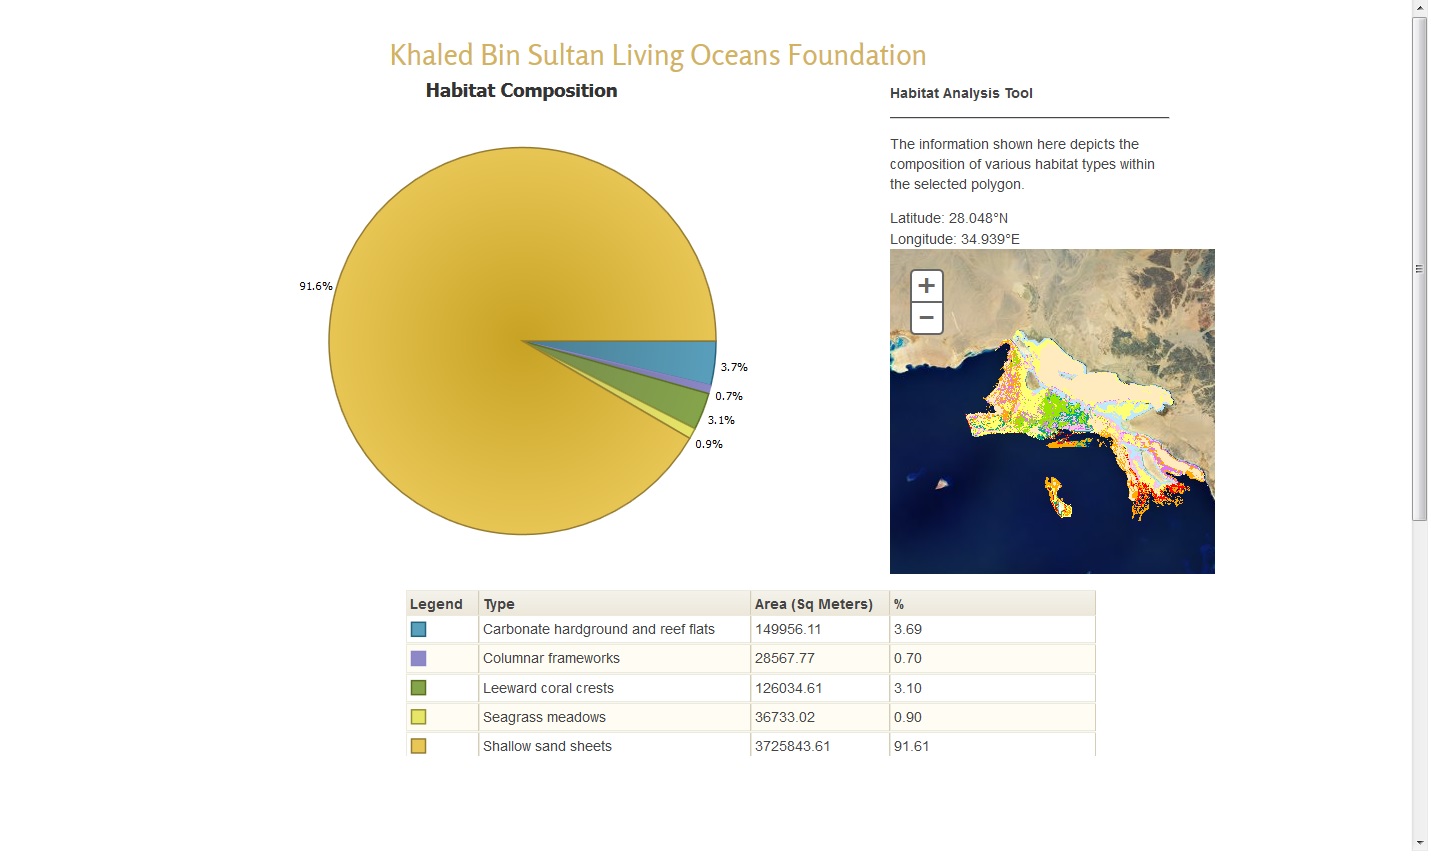
When the analysis process is complete, clicking View Report will open the report in a pop-up window. The report displays a pie chart showing the composition of habitat types relative to each other in the analysis area, the vertices of the defined polygon or the latitude and longitude of the center point and radius measurement, a legend showing the various habitats types, their area in the selected measurement units, and the percentage of area within the defined location. Any additional information about the data will be displayed in the bottom left corner.
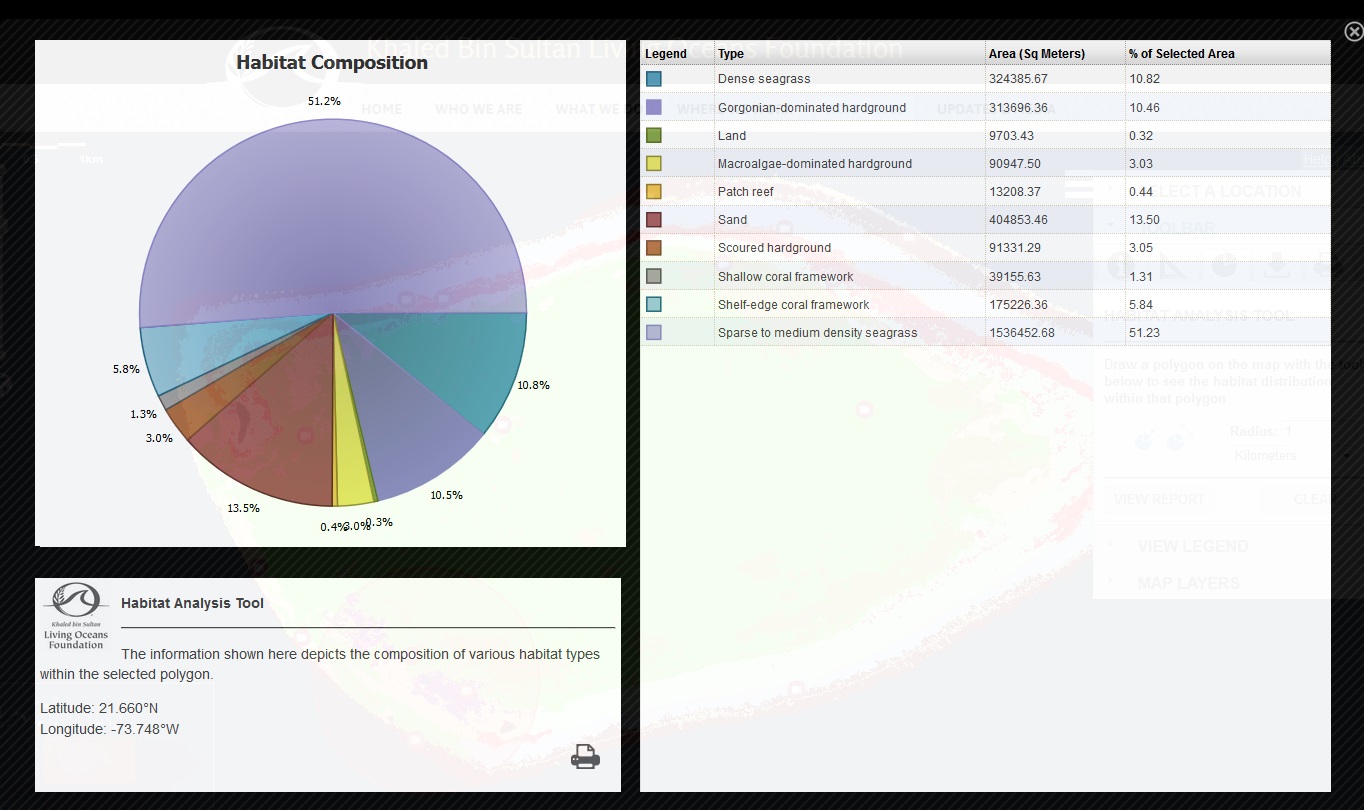
Click the Print button in the lower left of the report to open the report in a new browser window and print using your local printer, or click the X in the upper right corner to close the onscreen report.
Data Download
![]() The Data Download tool allows you to download compressed (.ZIP) datasets for any region that has been mapped. No matter where you are zoomed to on the map, you will see all of the regions available for download. The .ZIP files contain shapefiles for the habitat maps and bathymetric rasters (if available) for a particular region.
The Data Download tool allows you to download compressed (.ZIP) datasets for any region that has been mapped. No matter where you are zoomed to on the map, you will see all of the regions available for download. The .ZIP files contain shapefiles for the habitat maps and bathymetric rasters (if available) for a particular region.
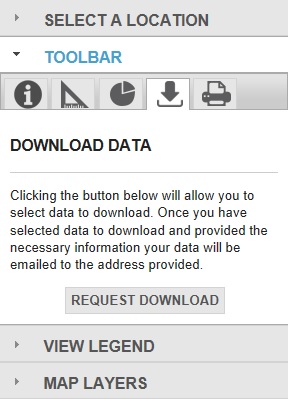
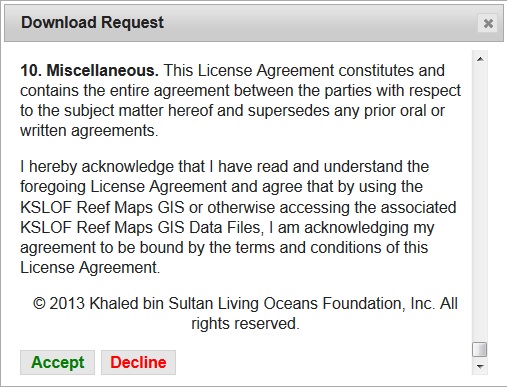
Click REQUEST DOWNLOAD and read the Download Request END USER LICENSE AGREEMENT. If you agree to the terms, click Accept. If you do not click Accept, you will not be able to download data.
Fill in the requested user information and check boxes to select the island areas you wish to download, and then select Submit at the bottom, left of the form.
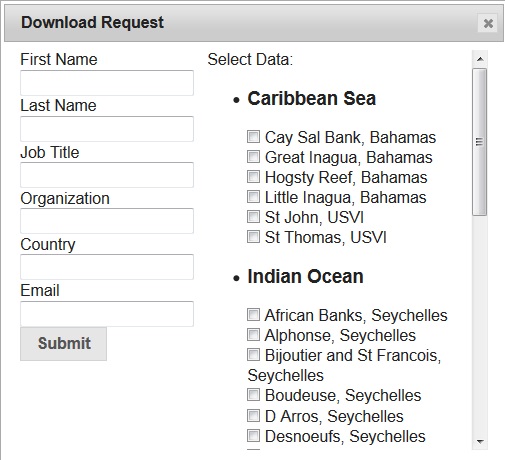
Once you click Submit, an email with a unique download link will be generated and sent to your email address. The link will expire within 14 days.
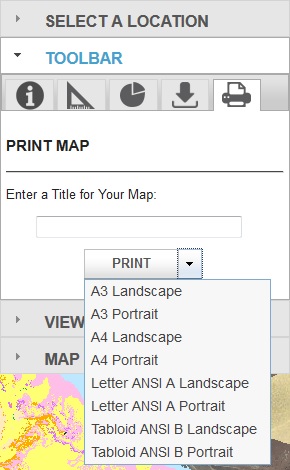
Print
Clicking the Print button displays a dialog box allowing you to print the currently viewed area of the map. You may type in a title for your map and select from a variety of page formats in the dropdown box. Click Print and a map will pop-up that you may save or print using your internet browser.
Map Legend
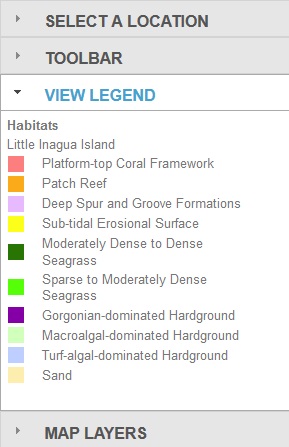
Click VIEW LEGEND to view the symbology of the active layers that are being drawn on the screen. To view which layers are active, click MAP LAYERS. The Legend is scale-dependent, so there may be nothing in the Legend at times if you are zoomed out far enough that nothing is being drawn on the screen except the base imagery.
The Habitats legend colors match the habitat type colors shown on the map.
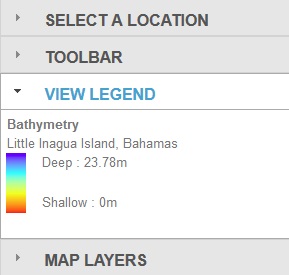
The Bathymetry legend is a color ramp that displays red as shallow areas and dark blue as deep areas. The maximum depth is not the same for each area, so a very dark blue may represent a different maximum depth in two separate locations.
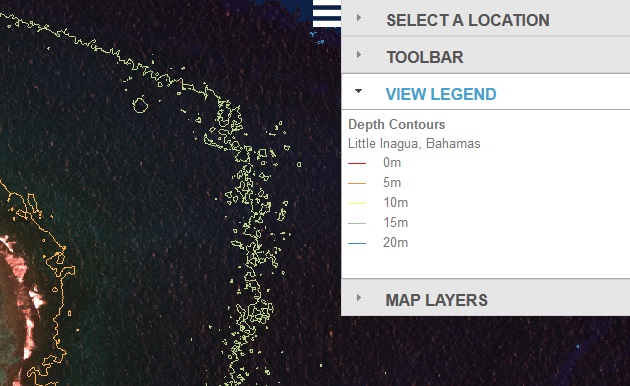
Depth Contours are depicted in 5 meter intervals.
Habitat Videos are tethered, underwater drop-camera videos that were collected by the Living Oceans Foundation during research expeditions at that exact latitude and longitude. The videos will play in a pop-up window that mimics the Identify Tool within the web map viewer.
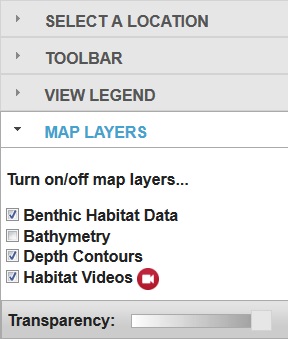
Map Layers
The map layers included in this web map viewer are Benthic Habitat Data, Bathymetry, Depth Contours, and Habitat Videos. Layers are only active and viewable if the box is checked on next to the layer name. All regions will contain at least Benthic Habitat Data, but not all regions will contain Bathymetry, Depth Contours, or Habitat Videos. The Benthic Habitat Data and Bathymetry layers may be toggled on and off and the transparency can be adjusted for these layers. The Benthic Habitat Data and Bathymetry layers may not be viewed at the same time, so one layer is always toggled off if the other is turned on by checking the box next to the layer name. Depth Contours may only be viewed on top of Benthic Habitat Data when active. Habitat Videos may be viewed on top of any layer when the box is checked to indicate the layer is turned on.